I just spent the last three hours doing research (admittedly taking short breaks to watch My Name Is Earl, The Office and Shark), and I’m about to fall asleep, but I’m going to do my best to put together the tallies for you.
What exactly did I research? Well, I was interested in how David Ortiz and Manny Ramirez worked together as a three-four combo in the middle of the lineup. I used the invaluable Retrosheet.org to comb through all 162 games in the Red Sox’s 2006 season. While I unfortunately neglected to note the win or lose outcome of each game (which may have been useful), I did come away with some good information.
David Ortiz and Manny Ramirez paired up for 121 total games over the season starting in the three-four combo. This means that out of the 41 games that they did not appear, a staggering 73 percent came in the final 36 games, when they only combined for six combos, and the final 21 games did not include any of these six combos.
I’m going to give the numbers now of how many good, average and bad games each player had and the corresponding game their counterpart in baseball’s most feared duo in history had. Just one note before I do so: the fact that David Ortiz bats third in front of Manny means that Manny’s good games must theoretically always invariably lead to good games for David Ortiz in terms of runs, while David Ortiz’s bad games invariably would also lead to more good games for Manny, as he would have more RBI opportunities.
There was no set criteria for a good, average, or bad game. I simply sketched out a general line of what good, average and bad was and then I deviated from it from game to game. If Ortiz had an amazing game and Manny had what many of us would term to be a “good” game, I gave Ortiz a good game point and Manny an average game point. This is why these numbers are not set in stone: not only are they subjective to what my definition of a good, average or bad game is, but I also slightly deviated from game to games based on the game one player had. I put more of an emphasis on RBIs, HRs, walks and hits (I did my best to treat walks just as good as hits, but walks are marginally worse, but that’s a discussion for another time). The more you struck out, the more you tilted to the “bad game” spectrum. The less hits you had, the more chance of a bad game.
Here is the breakdown:
There were 121 games that David Ortiz and Manny Ramirez started a game batting third and fourth.
- In David Ortiz’s 42 good games, Manny Ramirez had 14 good games, 11 average games and 17 bad games.
- In David Ortiz’s 35 average games, Manny Ramirez had 13 good games, 12 average games and 10 bad games.
- In David Ortiz’s 44 bad games, Manny Ramirez had 12 good games, 12 average games and 19 bad games.
- In Manny Ramirez’s 39 good games, David Ortiz had 14 good games, 13 average games and 12 bad games.
- In Manny Ramirez’s 36 average games, David Ortiz had 11 good games, 12 average games and 13 bad games.
- In Manny Ramirez’s 45 bad games, David Ortiz had 17 good games, 10 average games and 19 bad games.
Let’s break this down a bit more. David Ortiz tended to be much more erratic, as he had 42 good games, 35 average games and 44 bad games. He swung from one pendulum to the other. Manny Ramirez was much more consistent, as he had 39 good games, 36 average games and 45 bad games. I believe a good chunk of Manny’s bad games could be attributed to his injury late in the season, as the last six times the duo paired up, Manny had a bad game. If we eliminate these six games, the numbers read: 39, 36, 39. The definition of consistent. Never too high, never too low. This is part of what Manny’s calling card is as a hitter. He approaches every game and situation the same and doesn’t allow himself to get into a large rut, although it did take him until April 21 (18th game the duo had together) to hit a home run, when he hit two and Ortiz one.
Speaking of home runs, Manny and Ortiz both homered in the same game 10 times. Six of these games came in July. The dates are: July 1, 4, 6, 21, 24 and 31. Talk about a hot streak for the two of them. As a matter of fact, they both had good games six times in July, accounting for 43 percent of the time they both had good games at the same time.
Back to the numbers.
In David Ortiz’s 42 good games, Manny Ramirez had 14 good games, 11 average games and 17 bad games.
Manny Ramirez tended to have more bad games than anything else when Ortiz had good games. This is unsurprising, because when Ortiz has good games, he clears the bases and Manny loses RBI opportunities. Don’t forget that I also subjectively ranked these games based on the production of the other hitter. This means if Ortiz had a good game, Manny had to have a very good game to be ranked as both of them having a good game. If Ortiz had a good game and Manny did pretty good but not great, and could be listed under a good game, he was listed under average. The same applies for average, and Manny dropped a bit to bad. However, the variation is so slight – perhaps a couple of games here and there for every statistic, so the general premise holds: When Ortiz had a good game, Manny was more likely to have a bad game. Here he shows surprising inconsistency (for him) because he either tended to have a good game or a bad game, not an average game. The best way I can explain these numbers is that Manny had to have a very good game to keep up (which means a lousy pitcher was on the mound) or else his numbers simply didn’t hold a candle to Ortiz’s, accounting for the subjective drop in numbers.
In David Ortiz’s 35 average games, Manny Ramirez had 13 good games, 12 average games and 10 bad games.
Manny Ramirez doesn’t deviate too much here with Ortiz having average games. When Ortiz was “average” (if such a man can be called that) he was also consistent across the board. He didn’t step it up, but he didn’t step it down, either. The extra bump in good and average games mostly (but not all) came from the increased RBI opportunities or Ortiz simply getting on base but not driving in any.
In David Ortiz’s 44 bad games, Manny Ramirez had 12 good games, 12 average games and 19 bad games.
I’m actually not as surprised by this statistic as I should be. It stands to reason that someone of Ortiz’s caliber, who also had 42 good games, would have a bad game against a very good pitcher. Very good pitchers shut down offenses, and Manny is a hitter. If a good pitcher can shut down Ortiz, a good pitcher can shut down Manny. It goes rather hand in hand here, but then shouldn’t the same principle hold for the Ortiz good games stat? If Ortiz’s good games came from hammering bad pitchers, why did Manny have more bad games (17) than good (14) or average (11)? The subjective stat isn’t the answer here because the worse Ortiz looked, the better Manny’s line looked in comparison (especially that awful Golden Sombrero Ortiz notched August 2nd – but lets not talk about it). Thus, the same subjective number decrease Manny received in Ortiz’s good games would apply to the bump he got with Ortiz’s bad games. It can’t be that Ortiz simply had the better season, because Manny finished at a 1.058 OPS (best since 2002) and Ortiz at 1.049 (best ever). My guess? The really good pitchers shut down the two hitters who are exactly what they are billed as: Manny is a consistent hitter, Ortiz is a clutch hitter, but also prone to worse games because of his strikeout weakness and slight inconsistency.
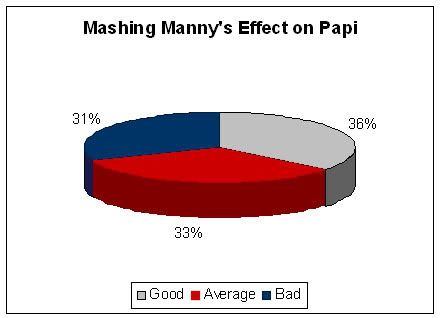
In Manny Ramirez’s 39 good games, David Ortiz had 14 good games, 13 average games and 12 bad games.
David Ortiz is rather consistent here despite being inconsistent in other areas. He certainly receives a bump in good games because he notches on more runs while still maintaining the same RBI totals as always (something Manny cannot say, as Ortiz cleans up in front of him).
In Manny Ramirez’s 36 average games, David Ortiz had 11 good games, 12 average games and 13 bad games.
Very consistent here as well. He receives a bump in runs scored via Manny’s average games, but he doesn’t deviate too much.
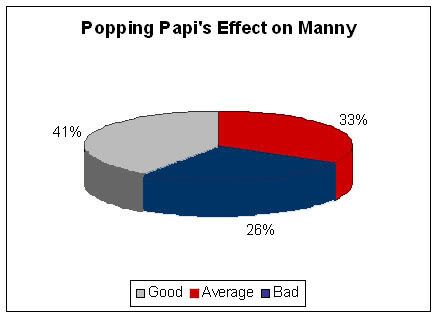
In Manny Ramirez’s 45 bad games, David Ortiz had 17 good games, 10 average games and 19 bad games.
Ah, now we see something tangible here. First, to continue the thread from the two previous statistics, we see that Manny’s good games and average games carry Ortiz to good or average games. It’s that simple. The better a game Manny has, the better a game Ortiz has. The reverse is not true because Ortiz bats in front of Manny, so Manny makes Ortiz look good. Ortiz doesn’t make Manny look good. In Manny’s bad games, Ortiz simply either couldn’t be carried up to a good game, or Ortiz simply became what he is: the greatest clutch hitter in Boston Red Sox history.
So what did I learn today? A fairly obvious thing: Manny makes Ortiz look good. But I also gave more credence to the fact that Ortiz is clutch and Manny is consistent. Evidence of the clutch factor: Manny has a bad game, David Ortiz picks him up. The numbers for that: David Ortiz had 42 good games, and Manny was bad in 17 of those. When Manny was bad in his 45 total games, Ortiz was good for 17 games. When David Ortiz had a bad game, Manny didn’t pick Ortiz up. Ortiz had 44 bad games, and Manny only had 12 good games in those bad games despite more RBI opportunties. In Manny’s 39 good games, Ortiz had only 12 bad games, and this is with me weighing RBIs more heavily than runs.
Essentially, what it boils down to is this: these two are amazing hitters, and Manny shows the ability to make David Ortiz look good and David Ortiz shows the ability to put the team on his shoulders. David Ortiz is the primary beneficiary of this arrangement, while Manny has to deal with a pitcher pitching to him much tougher than Ortiz because Manny can’t protect Manny. The clichÈ isn’t Manny protecting Manny, it’s Manny being Manny.
If you ask me what the point of this entire exercise was or what I took away from these numbers was, I’m not sure I can answer that question. I do know that I learned that when one person has a bad game, the other is also likely to have a bad game. Ortiz had 44 bad games, Manny was bad in 19 of them (the most). Manny had 45 bad games and Ortiz was bad in 19 games (the most). The difference comes from Ortiz being able to somehow achieve a higher ceiling in those games, as he also had 17 good games and 10 average ones in Manny’s 45 bad games while Manny had 12 good games and 12 average games to go along with his 19 bad games in Ortiz’s 44 bad games.
In the end, the only numbers that matter are 34 and 24. I hope I see these numbers for 173 games in the third and fourth spot in the lineup this upcoming year.
By the way, the most recent poll results?
Should Curt Schilling be resigned?
* Yes! One year. $13 million. Do it!
75% of all votes
* Yes, but for less than $13 million.
18% of all votes
* Yes, even if it’s a two-year extension or more money.
4% of all votes
* Sorry, Curt. Go pitch somewhere else in ’08.
4% of all votes
Red Sox Nation has spoken. Go sign him, Theo! And vote on the new poll on the right!