As some of you may have been able to tell by the proclivity of my posts to include tables of data from some new found online tool or database that I happened to stumble upon, I love finding new ways to analyze what we live and watch every day with our favorite pastime.
What I love most about the way statistics and baseball interact, isn’t the accumulation of stats as a way to measure the greatness or lack there of a baseball player, but rather the more subtle cues that data give to what is happening in the game you are watching and why. The statistically significant data that the large sample sizes baseball at bats tend to allow bring context to otherwise meaningless events.
I recently ran across this post at one of my favorite stops in the baseball blogosphere, Fan Graphs, where they announced the addition of plate discipline stats to their player database. While PITCHf/x has given me a great tool to dig more deeply into pitchers performance (I have yet to look at that data from a hitters perspective, which I plan to do soon), plate discipline stats give you a better context to how hitters, and as we will see with the Red Sox entire lineups, approach at bats. I’ll leave it to the experts at Fan Graphs to describe the actual data points represented as “plate discipline”.
- O-Swing%: The percentage of pitches a batter swings at outside the strike zone.
- Z-Swing%: The percentage of pitches a batter swings at inside the strike zone.
- Swing%: The overall percentage of pitches a batter swings at.
- O-Contact%: The percentage of pitches a batter makes contact with outside the strike zone when swinging the bat.
- Z-Contact%: The percentage of pitches a batter makes contact with inside the strike zone when swinging the bat.
- Contact%: The overall percentage of a batter makes contact with when swinging the bat.
- Zone%: The overall percentage of pitches a batter sees inside the strike zone.
Basically, how often do you swing at balls vs. strikes and what is the result in terms of the ability to make contact.
I initially wanted to use this tool to take a quick look at Dustin Pedroia and see if he was as much of a contact hitter as it appears, but as I found myself playing with the data, a table of the entire Red Sox lineup proved to be most interesting. I’ve included the table below, but as it’s pretty small, I would encourage you to view the larger version I uploaded to Flickr.
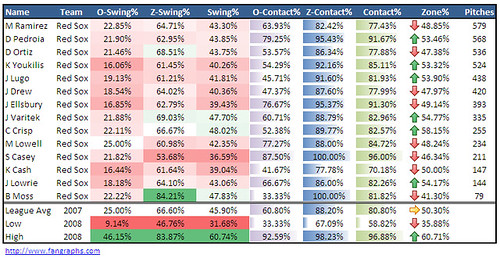
There’s alot of data here, so I tried to use some colors, graphs, and icons to make some sense of it. What you see is each player (minus Alex Cora and Joe Thurston) on the Red Sox roster and the plate discipline stats for each.
If you’ll focus at the bottom of the table for a second, you will see a row for “league average” for 2007 to give context to a baseline for discipline. You will also see the individual high and low for that stat for the 2008 season.
Let’s look at this table bucket by bucket. The first area, comprised of O-Swing%, Z-Swing %, and Swing%, gives us an idea as to how often the player swings at a pitch both in and out of the strike zone. You would expect, given the Red Sox hitting philosophy of working counts and making pitchers throw more pitches than they would like, that the Red Sox would be below league average in all of these categories. If you did make that guess, you would be right.
I used a “relative heat map” on these three data points where red represented the proclivity to take pitches and green to swing against a league average of white.
Every member on the Red Sox roster took more pitches out of the strike zone than league average, except Mike Lowell who is equal to league average. The keenest batting eye at recognizing and laying off pitches outside of the zone was was none other than Kevin Youkilis. Sometimes, reputations live up to reality. There are no free swingers in the Red Sox lineup.
What I find most encouraging about the first column is the keen batting eye of the younger Red Sox players, Jacoby Ellsbury, Dustin Pedroia, Jed Lowrie, and Brandon Moss. This is clearly an organizational philosophy that has taken root and flourished.
Moving to the next column, the measure of percentage of balls in the strike zone that batters swing at, the Red Sox are still consistently at or below league average. Brandon Moss is the most glaring outlier swinging at almost 85% of the balls he sees in the strike zone (the remarkable thing is what he does with those pitches…but I will save that thought), but he also has the smallest sample size of pitches to work with. While Jason Varitek and David Ortiz swing more than other Red Sox hitters at balls in the zone, Sean Casey watches the ball hit the mitt in the zone nearly 47% of the time.
As you can see in the third column, Red Sox hitters keep the bat on their shoulders more often than not. The most free swinging of the Red Sox bats is Coco Crisp, just above league average, while Sean Casey takes the prize for standing still most often.
The next trio of stats tells you of the times that they swang (is that a word?) at pitches, how often did they make contact at balls in or out of the zone. For this data set, I went with the bar graph just to vary it up a little. Here you can see a little more variance in hitters abilities. The ability to make contact is less about approach and more about skill, most notably hand-eye coordination.
The worst hitters at making contact at balls outside of the zone; Brandon Moss, Kevin Cash, Julio Lugo, and J.D. Drew. In fact only five players were better than league average at making contact outside the zone; Sean Casey (87.5%!!!), Dustin Pedroia (79.25%), Mike Lowell, Jacoby Ellsbury, and Jed Lowrie. The wrench in this number however lies in the first column. The ability to have a keen eye of the zone means they are likely swinging at less “borderline” out of the zone pitches which are more likely easier to get a piece of.
The next column, contact rate on strikes, is more telling of ability to make contact with the baseball when a hitter should. Everyone is near or above league average with Manny Ramirez most likely to swing at a strike and miss (82.42% contact rate) and Papi not far behind him. In fact, it looks like more power hitters swing and miss at strikes than those not swinging a little more from the heels. The most unbelievable stat (and it almost makes me question the data) is that Brandon Moss and Sean Casey have yet to swing at a ball in the zone this year and not make contact. Even more interesting is that they are the most and least likely Red Sox hitters to swing at strikes in the first place. Also interesting to note Pedroia and Ellsbury’s success rates as “contact” hitters.
Overall, the Red Sox make contact when they swing. I am a little surprised to see Manny below league average at contact rate. I’ll have to investigate whether that is a 2008 trend or a pattern. Sean Casey is the contact king, connecting bat and ball on 96% of his swings. Dustin Pedroia and Jacoby Ellsbury also crack the 90% contact rate plateau.
Lastly, you can see the percentage of balls that each player is thrown that are in the strike zone. For the most part, this data hovers around the norm. The power hitters get stayed away from a little more than the bottom of the order dwellers who get challenged a little more often. Overall, I am surprised that, given the Red Sox hitters likelihood to watch strikes go by without swinging, pitchers don’t pump more by them early in counts when they can.
Given this was my first look at this data and the relative newness of the season still, I’ll refrain from more grand statements at this time. But I do think this gives us all an interesting perspective through which to follow at bats within the game.
If anyone else gathered any interesting take aways from this, feel free to leave them in the comments!
On a side note, Episode 6 of MVN Radio’s Red Sox Podcast, Fireside Chats, with myself and Paul Testa will hit the feeds after the game tonight. I had the pleasure of chatting briefly with Bill (billfer) from The Detroit Tigers Weblog last night in an interview that will air in tonight’s episode.